Build directional bias from Bias Score: composite per instrument
Bias Score gives a composite directional score per instrument with a bespoke confluence-signal list per asset (FX, commodities, indices). How to read score + conviction + breakdown.
Bias Score is an aggregator that combines multiple positioning + macro signals into a single directional score per instrument. The goal isn’t calling tops/bottoms, but answering one question: “if I enter now, is my trade direction aligned with big money and macro flow?”
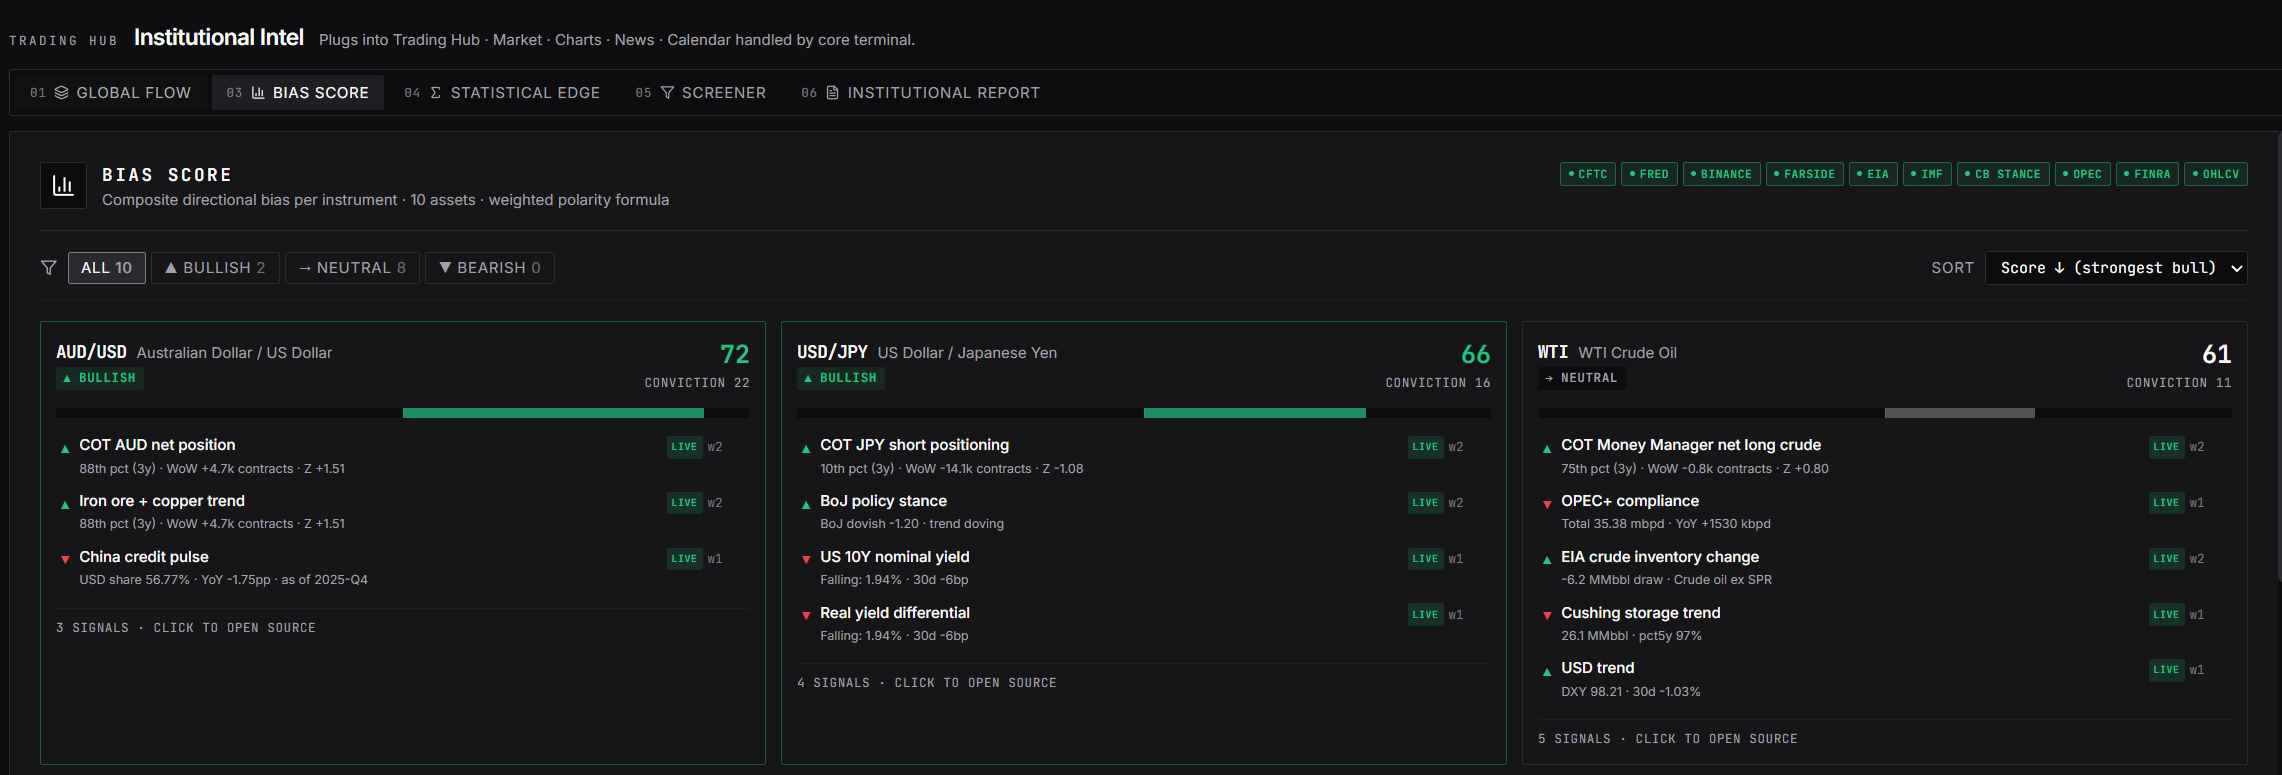
A common misconception: Bias Score is not a fixed 5-component formula across all instruments. Each instrument has its own bespoke set of confluence signals, what’s relevant for USD/JPY (BoJ stance, real yield differential) differs from what’s relevant for WTI Crude (OPEC compliance, EIA inventory, Cushing storage). The score is a weighted polarity blend over the signals that apply to that asset.
Panel layout
- Header: total assets covered + polarity filter (
ALL/+ BULLISH/− NEUTRAL/+ BEARISH) + search (find a specific asset). - Sort: by Score (strongest bullish first, or switch to strongest bearish).
- Per-asset card:
- Asset name + ticker (e.g. “USD/IDR · Australian Dollar / US Dollar”).
- Polarity badge: BULLISH (green) / NEUTRAL (yellow) / BEARISH (red).
- Bias Score (number): magnitude of directional bias.
- Conviction bar (%): how many of the confluence signals point the same direction as the score.
- Confluence signal list: 4–6 rows with signal label + weight contribution (green = supports score direction, red = fights it).
- Click a card → drill into the breakdown (per-signal chart, 6-month score history, etc.).
Asset coverage
Coverage isn’t limited to FX majors. It includes:
- FX major + crosses: EUR/USD, GBP/USD, USD/JPY, AUD/USD, USD/CHF, NZD/USD, USD/CAD, etc.
- EM FX: USD/IDR, USD/MYR, USD/INR (selectively, depending on data availability).
- Commodities: WTI Crude, Brent, Gold, Silver, Copper.
- Indices: SPX, NASDAQ (selectively).
Confluence signals per asset are domain-specific:
| Asset | Example confluence signals |
|---|---|
| USD/JPY | COT JPY short positioning, BoJ policy stance, US 10Y nominal yield, Real yield differential |
| USD/IDR | COT AUD net position (regional EM FX proxy), Iron + Copper trend (Indo export), China credit pulse, USD trend |
| WTI Crude | COT Money Manager net long crude, OPEC+ compliance, EIA crude inventory change, Cushing storage trend, USD trend |
| Gold | COT Money Manager net long, real yield 10Y, DXY, central bank reserves accumulation |
The takeaway: always click the asset to see the breakdown, don’t assume “5 fixed inputs”. It varies per asset.
Workflow: daily scan (3 minutes)
- Open Institutional Intel → tab Bias Score.
- Click the
+ BULLISHfilter. This shows every asset with a composite bullish bias. The list is sorted by score (strongest at top). - For the top 3 BULLISH:
- Check the conviction bar. Conviction > 70% = most signals aligned (5 of 6, etc.). High score with low conviction (40–60%) = score pulled by 1–2 extreme signals, not consensus → trade with smaller size.
- Click the card → open the breakdown. Identify the 1–2 strongest signals driving the score. If you agree with the logic (“BoJ really is dovish”, “OPEC compliance really is tight”), trade with more confidence.
- Repeat for the
+ BEARISHfilter. - For
− NEUTRAL, skip: no institutional edge, let daily technicals dictate. - Treat the output as a directional filter (long-only / short-only candidates) for the day, not a direct entry trigger.
Reading confluence signals
Each row in the breakdown shows:
- Label: signal name (e.g. “Real yield differential”, “OPEC+ compliance”).
- Direction: + (supports bullish bias) or − (supports bearish bias).
- Weight contribution (visual bar): how much this signal contributes to the final score.
What to use for conviction:
- 5–6 signals aligned = strong consensus. Score is reliable.
- 3–4 aligned, 1–2 fighting = mixed but tilted. Score reliable with a caveat, examine the fighting signals; there may be a developing counter-thesis.
- 2 aligned, 3 neutral/fighting = weak score, barely actionable.
Common pitfalls
- Using Bias Score as an entry trigger. This is a directional filter, not a trigger. Entries still come from daily technicals/fundamentals. Bias Score answers “may I long?” not “long now?”.
- Trusting the score without examining the breakdown. Score 80 with 2 extreme + 4 neutral signals is far weaker than score 65 with 5 aligned signals. Always click the card to confirm consensus.
- Assuming the same formula across all assets. USD/JPY and WTI Crude have totally different confluence signals. The composite score is comparable, but the drivers aren’t, learn the relevant ones for the asset you’re trading.
- Refreshing too often. Signals like CFTC COT update weekly (Friday evening ET). Signals like policy stance update per meeting/speech. Hourly refresh won’t move the score meaningfully.
- Ignoring stance differential in FX. Many users see “Fed hawkish = USD bullish” without checking the counterparty CB. ECB more hawkish than Fed = EUR/USD can rally even as Fed hikes. Bias Score already accounts for the differential, but make sure you understand the logic when reading the breakdown.
- Trading low-conviction instruments at full size. Bias Score conviction 45% = 1 of 5 signals aligned, the rest mixed. This setup isn’t high-conviction; position size should reflect that (50% size, or skip).
- Forgetting score timeframe. Bias Score reflects swing positioning (days to weeks). Not relevant for intraday scalps; can go stale for multi-month positions (macro shift before the score updates).