Decode CB Stance to anticipate FOMC reactions
CB Stance Score is an AI score from -3 (ultra dovish) to +3 (ultra hawkish) per central bank with factor breakdown + 6-meeting trend + key signals. How to use it to position pre/post-FOMC.
FOMC isn’t won by whoever reads the rate decision fastest, that’s already priced into fed funds futures. What moves the market 60 minutes after the release is stance: statement language, key signals from speeches, and shifts in the factor breakdown. CB Stance on Trading Hub Terminal scores each central bank (Fed/ECB/BoE/BoJ/RBA/RBNZ) on an AI-derived -3 to +3 scale, with a factor breakdown + 6-meeting trend for context.
How the score is computed
Score range: -3 (ultra dovish) to +3 (ultra hawkish), with category labels:
| Range | Label |
|---|---|
| ≥ +2.0 | ULTRA-HAWKISH |
| +1.0 to +2.0 | HAWKISH |
| +0.3 to +1.0 | MILD HAWK |
| −0.3 to +0.3 | NEUTRAL |
| −1.0 to −0.3 | MILD DOVE |
| −2.0 to −1.0 | DOVISH |
| ≤ −2.0 | ULTRA-DOVISH |
Score is a weighted aggregation of multiple factors: Forward Guidance (w=30%), policy decision, key signals from speeches, and other components (see the STANCE FACTOR BREAKDOWN panel for the full list + each factor’s weight, formula score = Σ(raw × weight) is published transparently in the panel).
Updates happen:
- On rate decision release (statement scoring).
- When voting members give public speeches (key signals refresh).
- On SEP / dot plot release (forward guidance update).
There’s no 10-day blackout for scoring per se, but speech inputs do stop during blackout, so the score tends to plateau in that window.
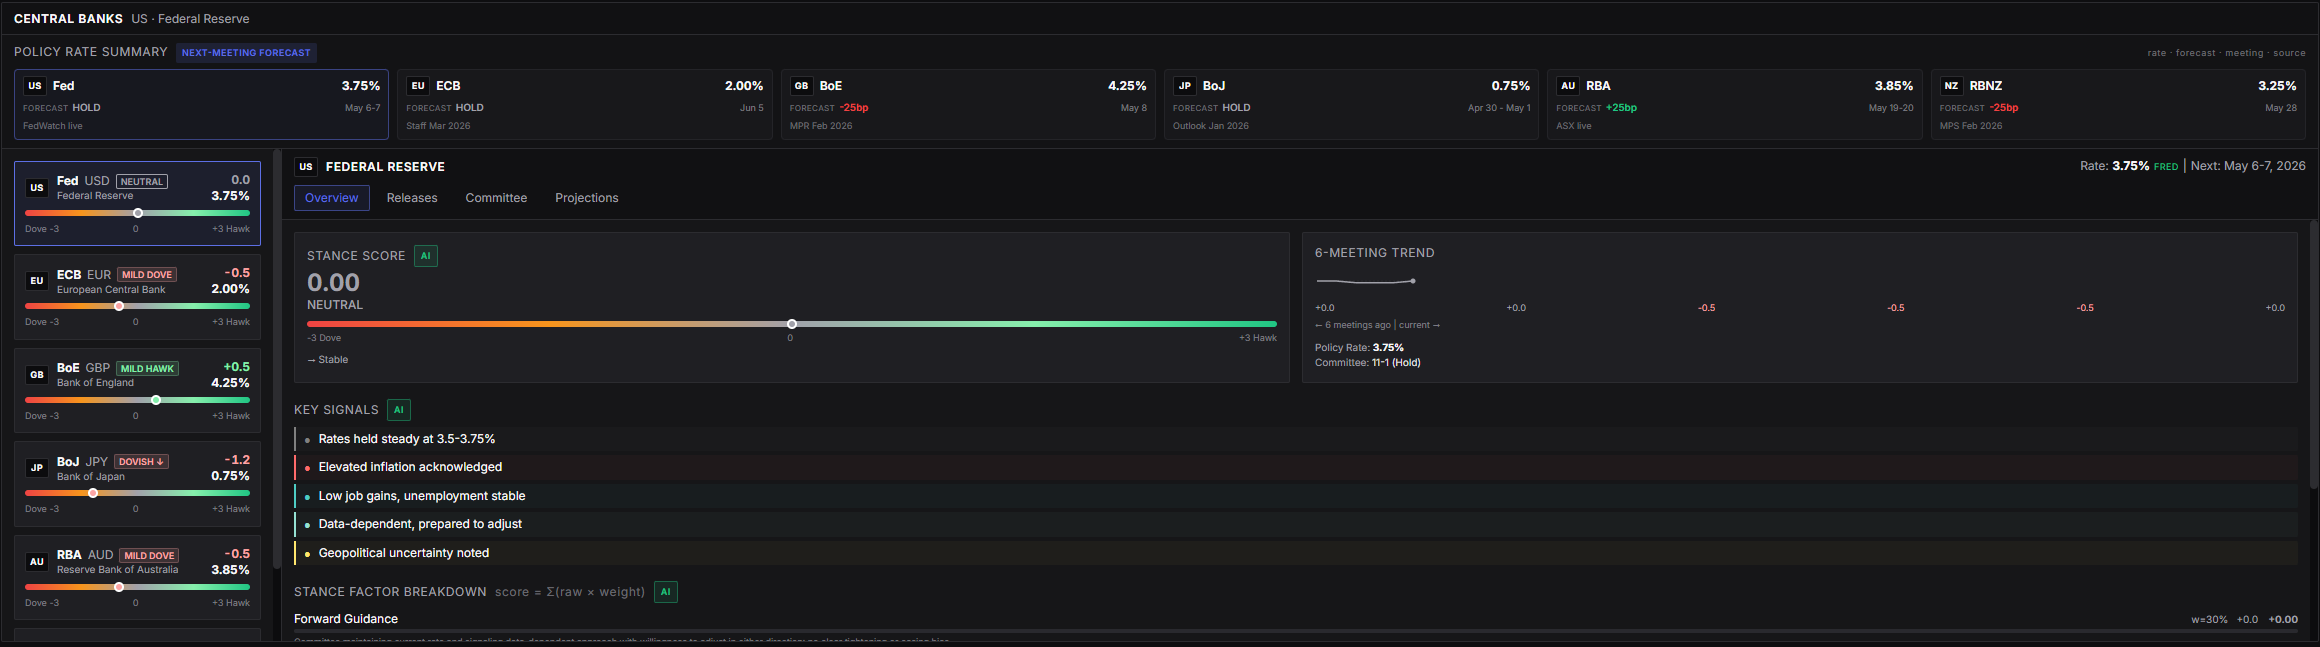
Central Banks panel layout (/intel)
- POLICY RATE SUMMARY (header): card per CB with current rate + next-meeting forecast (HOLD / +25bp / −25bp) + meeting date + forecast source (rate-expectation live, Staff projections, OIS, etc.).
- Sidebar list (left): 6 main central banks with a Dove -3 → +3 Hawk stance bar + score value + category label. Natural sort (Fed first).
- Detail panel (right): click a CB to see:
- Overview / Releases / Committee / Projections tabs.
- STANCE SCORE main number + visual bar.
- 6-MEETING TREND mini chart, score history over the last 6 meetings, with → / ↑ / ↓ arrow for trend direction.
- KEY SIGNALS list (AI-extracted): 5 bullet points from latest statement & speeches, color-coded by polarity (red = hawkish lean, green = dovish, yellow = neutral).
- STANCE FACTOR BREAKDOWN: factor table + raw score + weight + contribution. Click a factor to see the extracted text detail.
Workflow: position pre/post-FOMC
- H-2 (two days before meeting), open
/intel→ Central Banks → Fed. Note:
- Current score (e.g. 0.0 NEUTRAL).
- 6-meeting trend: direction of the score (drifting hawkish or dovish).
- Top 2 latest key signals as Fed-language context.
- Next-meeting forecast (HOLD / cut / hike) from the summary card.
- H-1, check the counterpart CB score (for pair trades). USD/JPY trade: also look at BoJ. Fed mild hawk + BoJ dovish ↓ = USD/JPY upside bias.
- T-30 minutes, flat exposure in USD pairs. Pre-FOMC volatility is often fake; don’t trade technical triggers in this window.
- T-0 (rate decision release), let the partial update arrive. Don’t trade in the first 5 minutes. Initial reactions often reverse after the headline algos finish.
- T+5 to T+25, compare new score vs pre-meeting score:
- Δ score +0.5 or more (hawkish surprise) → USD bullish, gold/EM FX bearish.
- Δ score −0.5 or more (dovish surprise) → USD bearish, equity & gold bullish.
- |Δ| < 0.3 (in-line) → fade the initial reaction, expect reversal.
- T+30 to T+60, at quarterly meetings (SEP release), refresh the score with the dot plot. The Forward Guidance factor often shifts from “statement in-line” to “dot hawkish”, second opportunity.
- T+60+, full update post-press conference. Key Signals refresh with phrases extracted from the Powell Q&A. What most often changes direction: Q&A tone. Score can move 0.5–1.0 from T+0. Re-evaluate the position.
Common reaction patterns
- Hawkish hold: rate unchanged, but statement & forward guidance more hawkish. Stance score shifts hawkish (magnitude varies per meeting). USD typically rallies, 2Y yield rises. Largest reactions occur when the market priced a dovish hold beforehand.
- Dovish hike: rate up (as expected), statement soft, Powell stresses “data-dependent” in Q&A. Score drops. USD sold, equity rallies.
- In-line: |Δ score| < 0.3. 15 minutes of initial vol, then mean-revert. Best traded as a fade.
Cross-CB comparison for FX trades
For pair trades like EUR/USD: you need a stance differential. Read it off the sidebar:
- Fed +0.5 (mild hawk), ECB +1.0 (more hawkish than Fed) = differential +0.5 for EUR. EUR/USD bullish bias even with Fed hawkish.
- Fed −0.5 (mild dove), ECB −1.0 (more dovish) = differential −0.5 for EUR. USD relatively strong on rate divergence.
Same logic for USD/JPY (Fed vs BoJ), GBP/USD (Fed vs BoE), etc.
Common pitfalls
- Trading headline rate decision only. The rate is already priced via OIS curve. If you’re reacting to “Fed hold” without checking the stance score, you’re 30 seconds behind HFT.
- Treating T+0 score as final. T+0 score only includes the statement factor; can shift > 0.5 after Q&A. Large positions on the partial update without a stop = exposed to a T+60 reversal.
- Ignoring the counterpart CB. USD reaction doesn’t depend on Fed alone. Compare Fed vs ECB/BoE/BoJ for the relevant FX trade.
- Not reading Key Signals. The numeric score is a summary; Key Signals are the evidence moving it. If Key Signals lean red dominant but the score is neutral, there’s an update lag, trade assuming a hawkish shift in coming days.
- Fading in-line without technical confirmation. “In-line = fade” isn’t an absolute rule. If a strong technical level just broke from the initial spike, leave it. Fade only when the initial move stalls mid-range without breaking a level.
- Forgetting the -3..+3 scale (not 0..100). Extreme scores +2.5 or -2.5 are rare, central banks usually live in ±1.5. Don’t underestimate a “merely” +0.5, that’s already a meaningful shift from neutral.
- Ignoring the 6-meeting trend. Score +0.5 rising from 0.0 (trending hawkish) is more meaningful than score +0.5 falling from +1.5 (trending dovish). Always check trend direction, not just the value.