Anticipate central bank pivots from real yield + stance score
Combine 10Y Real Yield with the CB Stance Score to detect policy shifts earlier than the rate-cut signal in the market.
A central bank pivot, the shift from hawkish to dovish or vice versa, is usually priced in by the market 4–8 weeks before the official announcement. What moves first: real yield (10Y nominal yield minus expected inflation). What moves shortly after: CB Stance Score (a hawkish/dovish score from statements & speeches). Combining the two gives lead time to rotate positions ahead of the rate decision.
Components used
Two signals from two different terminal panels:
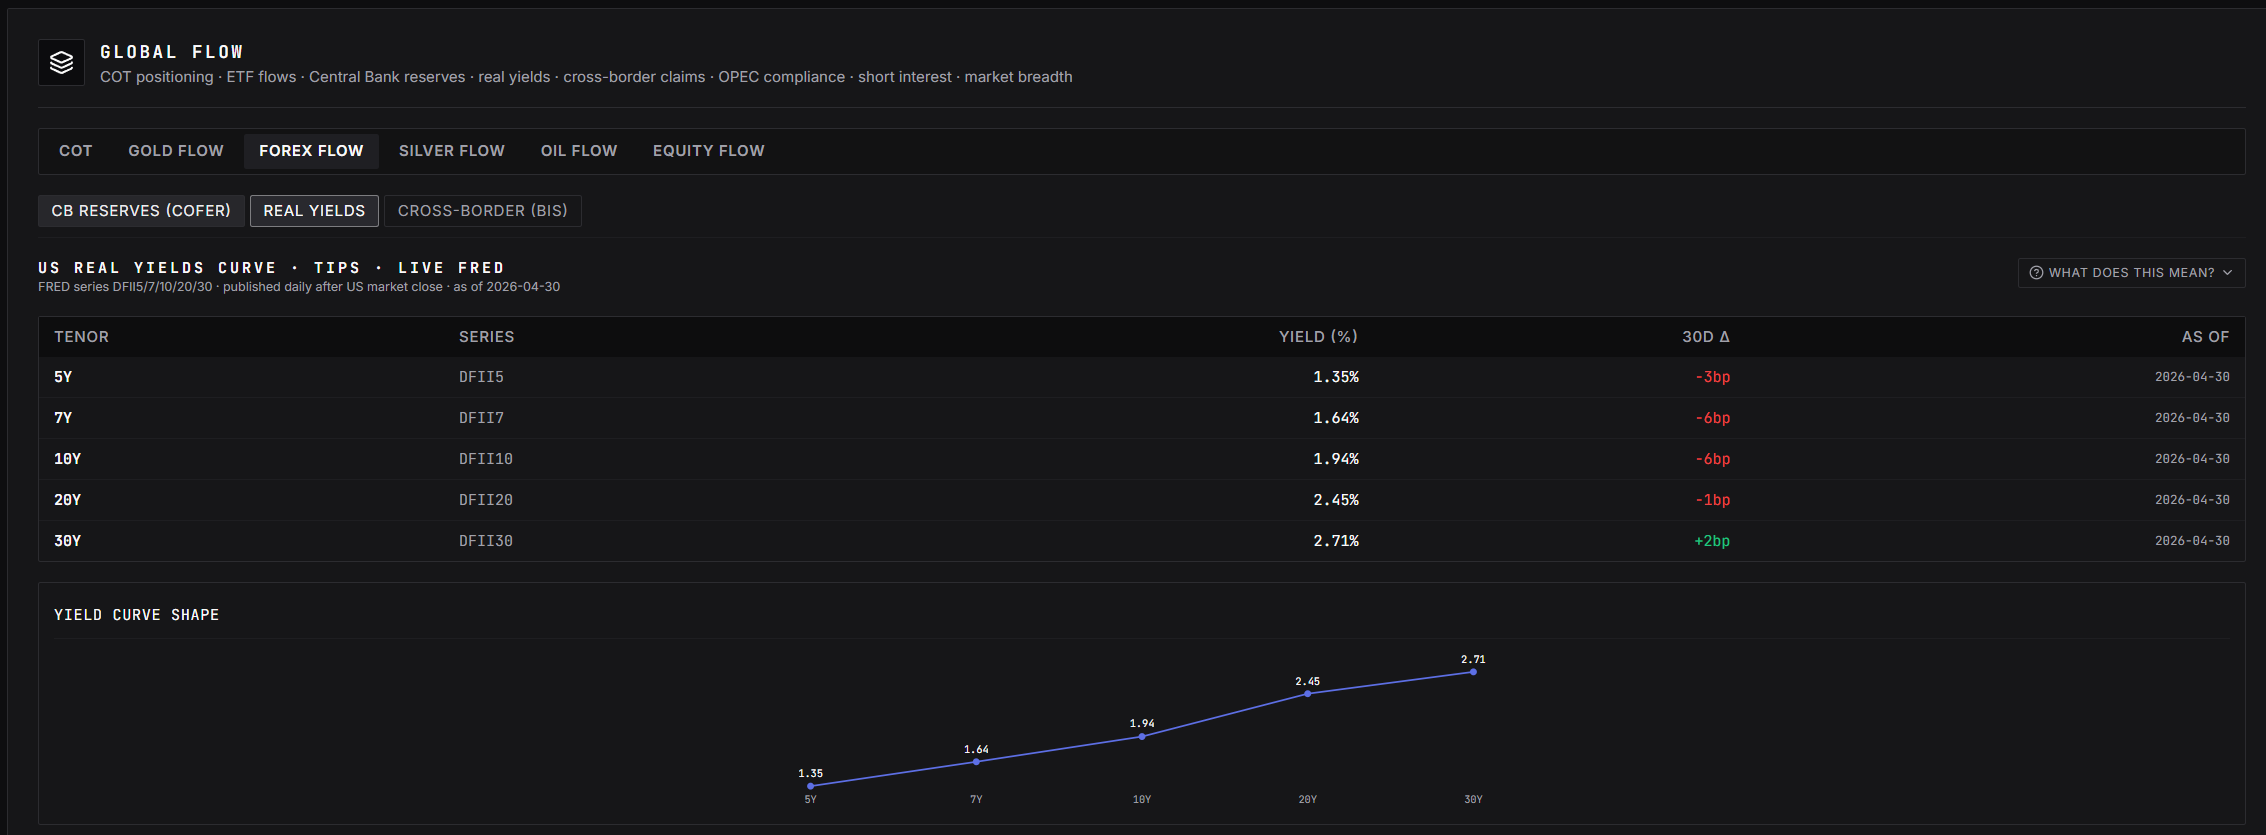
- Real Yield Surface, panel Institutional Intel → Global Flow → Real Yields: 10Y Treasury nominal yield minus 10Y TIPS breakeven inflation, plus a multi-tenor surface (5Y, 10Y, 30Y). Sourced from FRED. Moves daily.
- CB Stance Score, panel
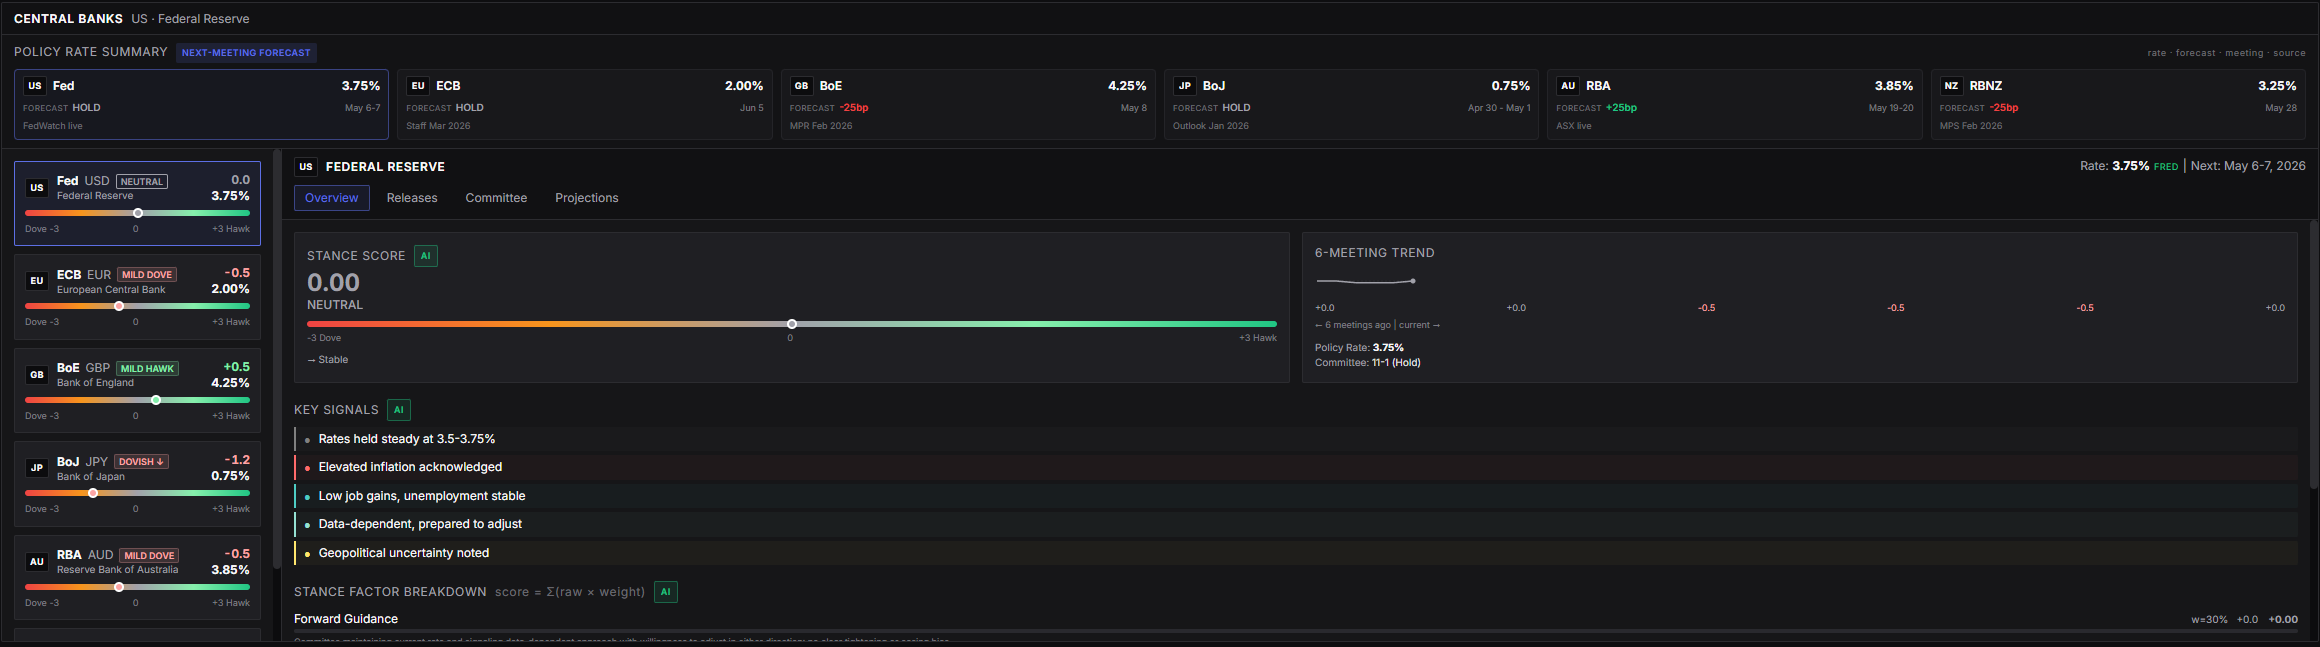
/intelCentral Banks: AI score from -3 (ultra dovish) to +3 (ultra hawkish) per central bank (Fed/ECB/BoE/BoJ/RBA/RBNZ). Updates on statement release, voting-member speeches, and SEP/dot plot release.
The logic: real yield rising = the market is pricing tighter policy ahead. Real yield persistently falling = the market is anticipating easing. CB Stance provides confirmation (or divergence) from the bank’s own language, has the Fed itself shifted, or is the market ahead?
Workflow: detect a pivot signal
- Open
/intel→ Central Banks. Note:
- Current CB Stance Score for the Fed (e.g. 0.0 NEUTRAL).
- 6-meeting trend from the mini chart, direction (drifting hawkish or dovish).
- The relevant counterpart score (ECB/BoE/BoJ/BI) if you watch FX pairs.
- Switch to Institutional Intel → Global Flow → Real Yields. Look at the 30-day direction of real yield 10Y:
- Real yield down > 30bp in 30 days = market positioning for easier policy.
- Real yield up > 30bp = market positioning for tighter policy.
- Compare against the CB Stance Score trajectory (6-meeting trend):
- Real yield down + Stance score also down = confirmed dovish pivot, strong signal. Position USD short, gold long, equity long, rate-sensitive sectors long.
- Real yield down + Stance score still hawkish = market ahead, Fed not following. Tricky setup, if the Fed reiterates hawkish in the next speech, real yield can snap back. Keep size small.
- Real yield up + Stance score also up = confirmed hawkish trajectory. Position USD long, gold/equity defensive.
- Real yield up + Stance score down = rare, usually transient (temporary data surprise).
- Check the Releases tab in the Central Banks detail for upcoming voting-member speeches. If the Fed Chair speaks within 2 weeks, hold off on repositioning, the Chair’s speech often shifts the stance score meaningfully in a single day, especially when policy language diverges from the prior statement.
Common pre-pivot patterns
- 3–6 months before first cut: real yield starts falling, Stance score still elevated (mild hawk +0.5 to +1.0). Market is ahead, the Fed is still cautious.
- 6–10 weeks before first cut: Stance score starts drifting toward neutral (0.0) and into mild dove territory, more members turn dovish in Key Signals, real yield accelerates lower. Confirmation phase.
- 2–4 weeks before first cut: Stance score is clearly dovish (-0.5 to -1.0), market is fully priced. The pivot trade edge is exhausted here, too late.
- Cut day: if in line with expectations, market reaction is relatively small. A dovish surprise (larger cut or softer forward guidance) = continuation move.
Common pitfalls
- Trading a single signal. Real yield falling can be from rising expected inflation (not falling rate expectations). Stance score falling can be from one dovish member while the majority remains hawkish. Always confirm with two signals.
- Assuming pivot = monotonic. Pivot signals frequently false-start: real yield falls for 2 months, then a hot CPI print → real yield snaps back up. Move incrementally, don’t go all-in at the first signal.
- Forgetting cross-bank context. Fed dovish pivot + ECB dovish pivot = USD relatively stable (both sides of the pair weak). Fed dovish + ECB hawkish = USD clearly down. Always compare both sides of a pair for FX trades.
- Skipping the blackout period. 10 days before FOMC, members can’t speak publicly. Stance score plateaus in this window (speech inputs stop). What appears = observational data, not new language signal.
- Forgetting the -3..+3 scale (not 0..100). If you’re used to thinking “score 70 = hawkish”, remember the terminal scale -3..+3. Even +0.5 is a meaningful shift from neutral. Trigger thresholds are 0.5–1.0 for meaningful Δ, not 10–15 points.
- Trusting market pricing with 100% conviction. Real yield reflects median expectation, not certainty. Surprise data (NFP, CPI) can flip expectations within hours. Hold positions with stops, not full conviction.