Track regime shifts to adjust correlation expectations
When the market shifts to risk-off, DXY/Gold/SPX correlations change significantly. How to identify the shift via the Regime panel under Statistical Edge.
“Gold and DXY are always inverse” is one of the most persistent, and most dangerous, myths during a regime shift. The standard cross-asset correlations (DXY ↔ Gold, SPX ↔ Bond, JPY ↔ Risk) only hold within a particular regime. When the market moves from risk-on to risk-off (or vice versa), correlations often flip or collapse. Trading on historical correlation without checking the active regime = a setup that looks valid but fails systematically.
This workflow uses the Regime (Gavekal) panel under Institutional Intel → Statistical Edge to identify the active regime and adjust correlation expectations before entry.
Framework: 2×2 growth × inflation
The regime panel is built on two dimensions plotted as quadrants. Derived from FRED:
- Growth proxy: Industrial Production YoY (
INDPRO). > 0 = expansion. - Inflation proxy: Core PCE YoY (
PCEPILFE). - Liquidity (secondary): M2 YoY + M2 Impulse (Δ M2 YoY rolling 3 months = “is liquidity expanding faster or slower than 3 months ago?”)
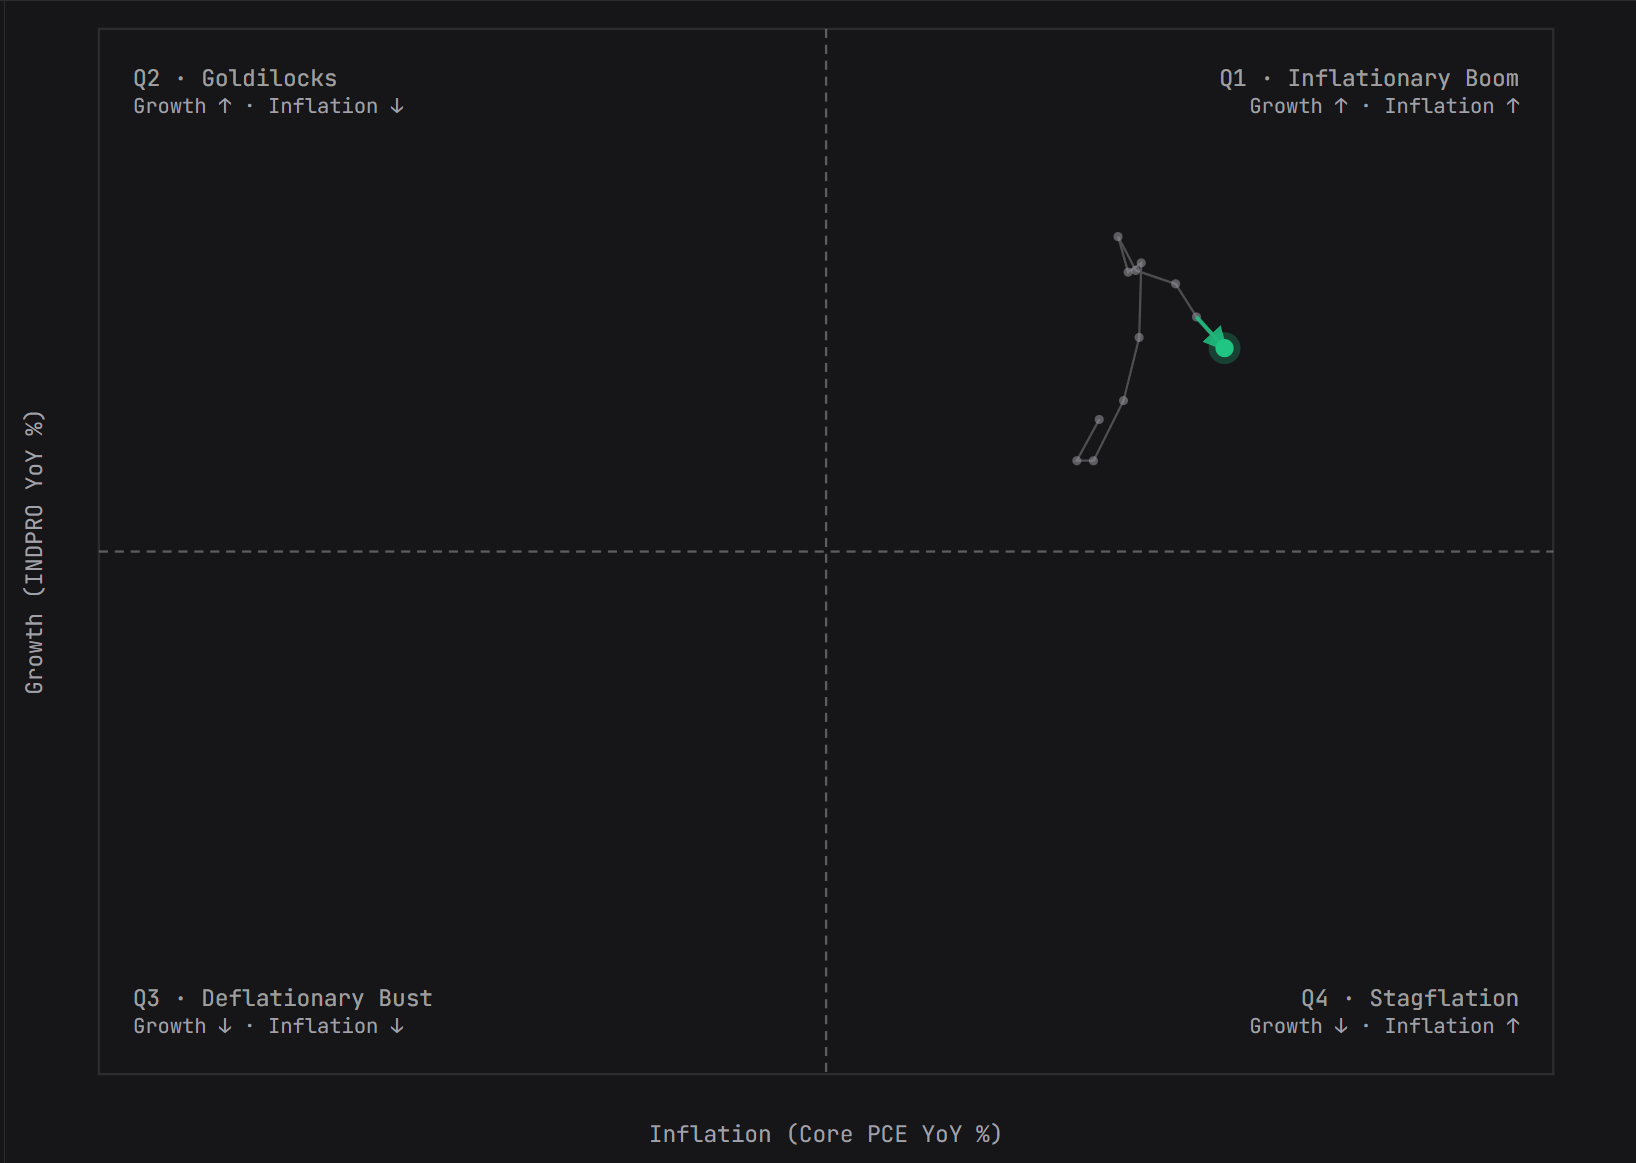
The combination of growth × inflation forms 4 regime quadrants (labels per the terminal):
| Quadrant | Label | Growth | Inflation | Historical asset bias |
|---|---|---|---|---|
| Q1 | Inflationary Boom | ↑ | ↑ | Commodities + hard assets strong, USD mixed, Equity continues but rate-sensitive sectors weak, Bond bearish |
| Q2 | Goldilocks | ↑ | ↓ | Equity strong, USD weak, Gold mixed, Bond rally |
| Q3 | Deflationary Bust | ↓ | ↓ | Bond strong, USD strong (safe haven), Equity bearish, Gold mixed (deleveraging) |
| Q4 | Stagflation | ↓ | ↑ | Gold strong, Commodities strong, Equity bearish, USD mixed |
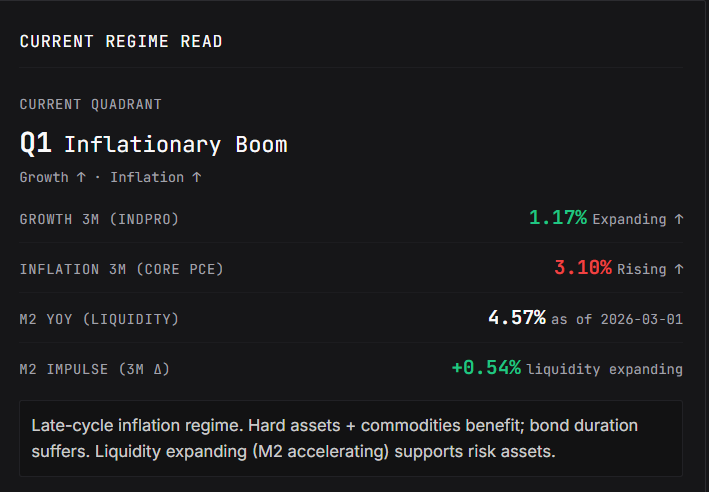
The “Current Regime Read” panel shows growth 3M, inflation 3M, M2 YoY, M2 Impulse, and a one-paragraph interpretation of the active regime:
Workflow: identify regime + adjust trade thesis
- Open Institutional Intel → tab Statistical Edge → sub-tab Regime (Gavekal).
- Read the active quadrant from the “Current Quadrant” label in the “Current Regime Read” panel.
- Note the M2 Impulse (3M Δ): positive (liquidity acceleration) or negative (deceleration). Liquidity is an amplifier, the same regime with expanding liquidity is more bullish for risk assets than the same regime without.
- Adjust correlation expectations before trade entry:
- Q2 Goldilocks: Long equity OK; gold won’t rally even if USD is weak (capital chases risk assets). A gold long needs a different trigger.
- Q1 Inflationary Boom: USD mixed + Gold/commodities strong + Equity holds up but rate-sensitive (REITs, utilities) weak. Hard assets + commodity producers favored. Bond duration suffers.
- Q4 Stagflation: Equity and Gold inverse (capital flees equity to gold). Bond is negatively correlated with a defensive bias. A risk-on equity setup = fighting the regime, low conviction.
- Q3 Deflationary Bust: USD safe haven (strong even when equity drops). Gold mixed (deleveraging sometimes forces gold sell). Bond is king.
- Check the M2 Impulse:
- Positive & accelerating: liquidity tailwind for risk assets, partly overrides regime bias.
- Negative & accelerating: tightening, defensive amplifier.
Concrete interpretation
Scenario: panel shows growth 3M (INDPRO) −0.5%, inflation 3M (Core PCE) +3.2%, M2 Impulse −0.3% (3 months of tightening). Current Quadrant: Q4 Stagflation with tightening liquidity.
Implications:
- Long equity setups need extra confirmation; default bias is defensive.
- Gold setups are bullish; trade with larger size than usual.
- USD ambiguous (stagflation is neutral for DXY), trade DXY as mean-revert, not trend.
- IDR + EM currencies pressured, defensive.
Common pitfalls
- Trading on 5-year correlation without checking the active regime. “Gold inverse DXY rate −0.7” might have been valid 2015–2020 (Goldilocks-dominant). But in 2022 (Stagflation → Deflationary Bust transition), DXY and Gold were positively correlated for 3 months. Adjust the reference period to the active regime.
- Reacting to a single monthly print. Growth and inflation move slowly. One outlier print (e.g. CPI surprise) doesn’t shift the regime, wait for 2–3 prints to confirm.
- Treating M2 Impulse as leading. M2 acceleration sometimes lags policy (CB cuts → M2 only rises 2 months later). Useful as confirmation, not as the initial trigger.
- Applying regime classification to short timeframes. Regime classification is for monthly-to-yearly context, not daily. Daily trading still follows technicals, but correlation expectations are set from the monthly regime.
- Forgetting transition periods. What’s trickiest isn’t an intact regime, but a transition between quadrants (Q2 Goldilocks → Q1 Inflationary Boom, or Q1 → Q4 Stagflation). During transitions, historical correlations collapse and cross-asset returns are chaotic. If the trajectory dot on the quadrant chart is near the crosshair (axis 0), treat it as a transition, reduce position size.
- Skipping other countries. US regime is dominant, but not monolithic. China deflation regime + US Inflationary Boom = a unique setup (USD-priced commodities are ambiguous). For EM equities, watch the relevant country’s regime as well.