ID EN
Intermediate 8 min read
Trace foreign flow to identify stocks under distribution
Use the Foreign Flow panel to spot IDX stocks foreigners are unloading and decide whether it's pure distribution or sector rotation.
Daily foreign flow on IDX is one of the least ambiguous positioning signals, institutional foreign investors report their transactions, and the daily aggregate reads cleanly. The frequent misreading: net foreign sell isn’t automatically bearish. It can be pure distribution (sell with no rotation back), sector rotation (sell A, buy B in another sector), or post-rally profit taking. This workflow separates the three using the Foreign Flow panel under Saham ID.
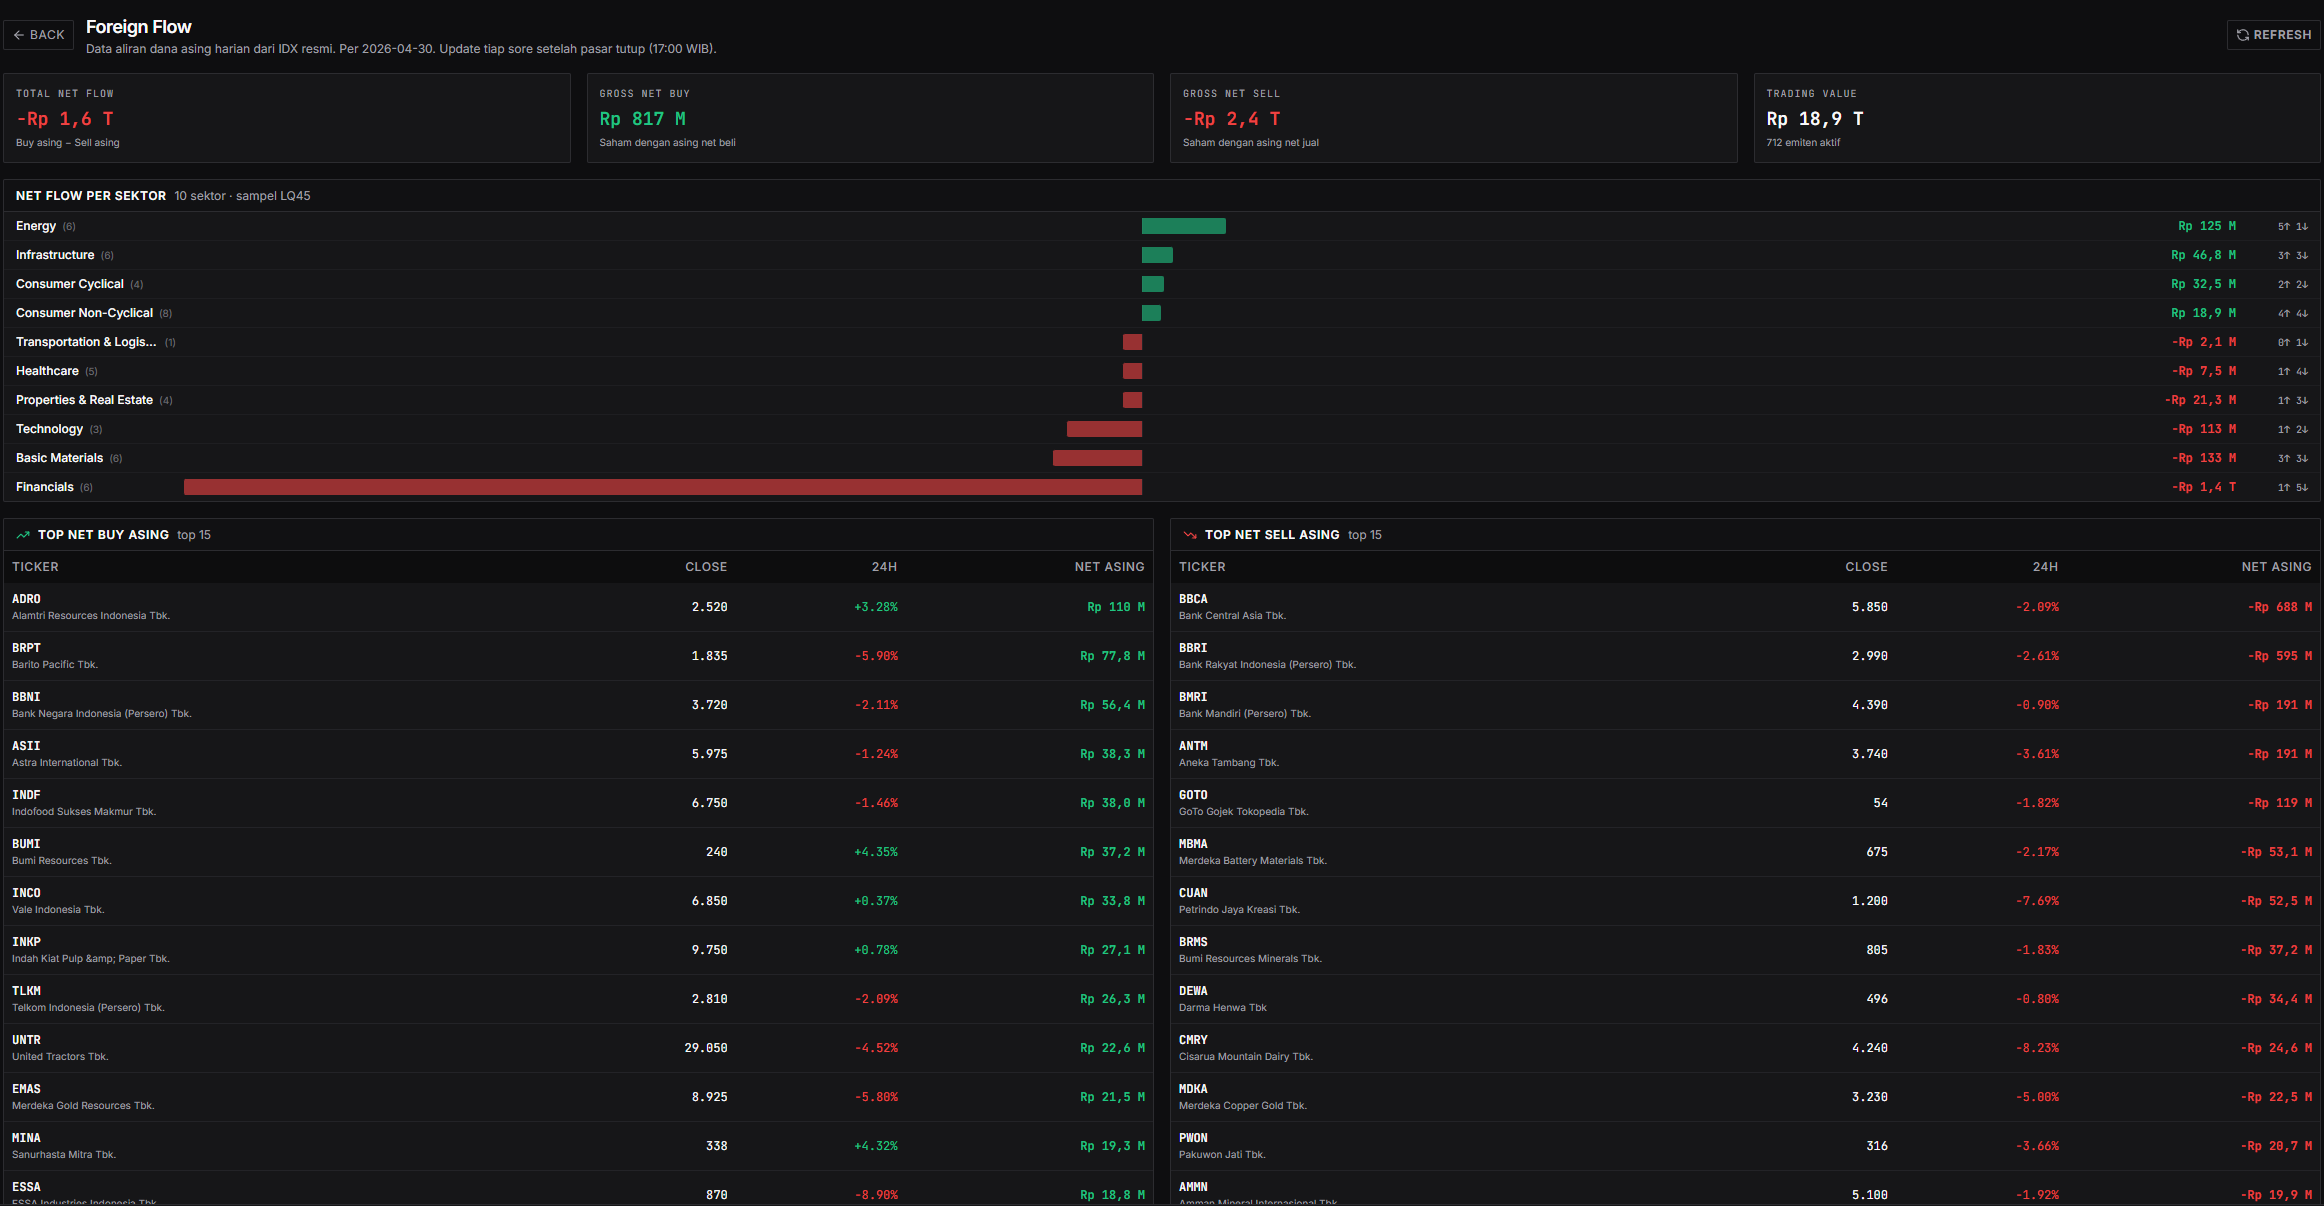
Panel layout
- Route:
/idx/foreign-flow. - Source: aggregation of
/api/idx-live/stock-summaryper emiten, filtered to day value > 0 (illiquid stocks excluded). - Three main sections:
- Top 15 net-buy emitens (sorted descending by IDR value).
- Top 15 net-sell emitens (sorted descending by absolute IDR value).
- Sector aggregation, net IDR per sector + count of gaining vs losing emitens.
- Header: freshness badge (when data was last updated) + manual refetch button.
Daily data, refreshed after IDX close (after 16:00 WIB).
Workflow: separate distribution from rotation
- Open
/idx/foreign-flow. - Look at Top 15 net-sell in the left column. Note the 3–5 emitens with the largest net sell (IDR value).
- Check each emiten’s sector:
- If the top 3 net-sell emitens are from the same sector (e.g. all banking), this is more likely sector rotation, not specific distribution.
- If top net-sell spans different sectors (banking + consumer + telco), this is more likely broad risk-off or fund redemption.
- Switch to the Sector aggregation section. Identify:
- Large net-sell sector with many gaining emitens = healthy profit taking (foreigners selling some, prices still up).
- Large net-sell sector with many losing emitens = distribution under selling pressure (foreigners selling + prices falling, downside still ahead).
- Large net-buy sector showing up alongside = the rotation destination, next watchlist.
- For the largest net-sell emiten you hold or watch, click through to
/idx/<ticker>for detail. Cross-check the multi-day pattern from the foreign flow panel on the detail page (is today an outlier, or part of a weekly trend?).
Three interpretation scenarios
- Specific distribution (most bearish): one emiten’s net sell is much larger than the rest, and its sector has no net-buy counterpart. That stock is being unloaded in a concentrated way. Avoid going long, and consider cutting losses if you’re holding.
- Sector rotation (neutral): net-sell in sector A with magnitude similar to net-buy in sector B. Capital isn’t leaving, just moving. Trade the rotation by following the net-buy sector.
- Broad risk-off (bearish for IDX overall): net-sell spread across many sectors, with minimal net-buy sectors. Foreigners are reducing IDX exposure overall. Defensive bias, cut long exposure, don’t open new setups.
Common pitfalls
- Looking only at IDR value, ignoring % of float. Net sell of Rp 50 billion in a Rp 500 trillion cap stock = noise. Same Rp 50 billion in a Rp 5 trillion cap = significant. Always contextualize against market cap.
- Treating foreign flow as price direction. Foreign net-sell + price up isn’t a contradiction, it means domestic absorption is strong. Domestic accumulation often precedes continuation.
- Skipping sector aggregation. Without sector context, it’s easy to misread distribution as rotation. Sector is the primary filter.
- Trading on a single day. Daily net flow is noisy. Rolling 3–5 day patterns are more reliable. If an emiten shows up in top net-sell three days running, then it’s serious distribution.
- Ignoring the freshness badge. If data hasn’t updated post-close (source delay), you’re reading stale data. Check the timestamp before deciding.
- Using the panel for small-caps outside coverage. The panel filters day value > 0, emitens that didn’t trade that day are silently excluded. Don’t assume an emiten that doesn’t appear has no flow.