Use Statistical Edge to validate setups via return distribution
Stat Edge gives you Signal Synthesis (BUY/HOLD/SELL with conviction), OLS price distribution, Gaussian/Skew stats, and a regime quadrant, how to read each sub-tab to filter setups.
Stat Edge is not a chart-pattern detector for flag/triangle/H&S. Stat Edge is return-distribution analysis, does the asset’s price sit at a statistically extreme location, are its daily returns Gaussian (normal) or heavy-tailed, and which macro regime is the asset currently in. The goal: filter setups by answering “does the current location & shape of the distribution support a directional trade, or is the market in mean-revert / chaotic mode?”
4 Stat Edge sub-tabs
| Sub-tab | Shows | Use for |
|---|---|---|
| Signal Synthesis | Weighted polarity blend across 4 dimensions (Distribution, Gaussian, Skew, Regime) → BUY/HOLD/SELL per asset with conviction % | Daily directional bias filter, contradiction warning |
| Price Distribution | OLS regression channel ±0.5/1/1.5/2σ (LOG SPACE) per asset, timeframe toggle 12M/10Y, plus 12-month statistics: Z-Score, OLS slope/yr, σ, R², daily mean, annual σ | Price location vs historical tendency |
| Gaussian / Skew | Daily-return moments table per asset, 12-month window: Mean/Day, Annual σ, Skew, Excess Kurt, JB statistic, Normality verdict (NORMAL / NON-NORMAL based on p<0.05 critical JB ≈ 5.99), Tail Read | Sizing, heavy-tailed distribution = smaller position |
| Regime (Gavekal) | 2×2 growth × inflation quadrant, current regime label, M2 impulse | Macro context for asset-class bias (see regime-shift article) |
Asset coverage
Stat Edge covers ±15 instruments across asset classes: Gold (XAU), Silver (XAG), Bitcoin (BTC), Ethereum (ETH), S&P 500 (SPX), NASDAQ 100 (QQQ), WTI Crude, Copper (HG), Dollar Index (DXY), EUR/USD, GBP/USD, USD/JPY, AUD/USD, NZD/USD, USD/CHF.
Suits macro / multi-asset swing traders. Doesn’t suit individual IDX stock traders (no coverage there, use the Indonesian Stocks screener).
Workflow: daily setup filter (5 minutes)
- Open Institutional Intel → tab Statistical Edge.
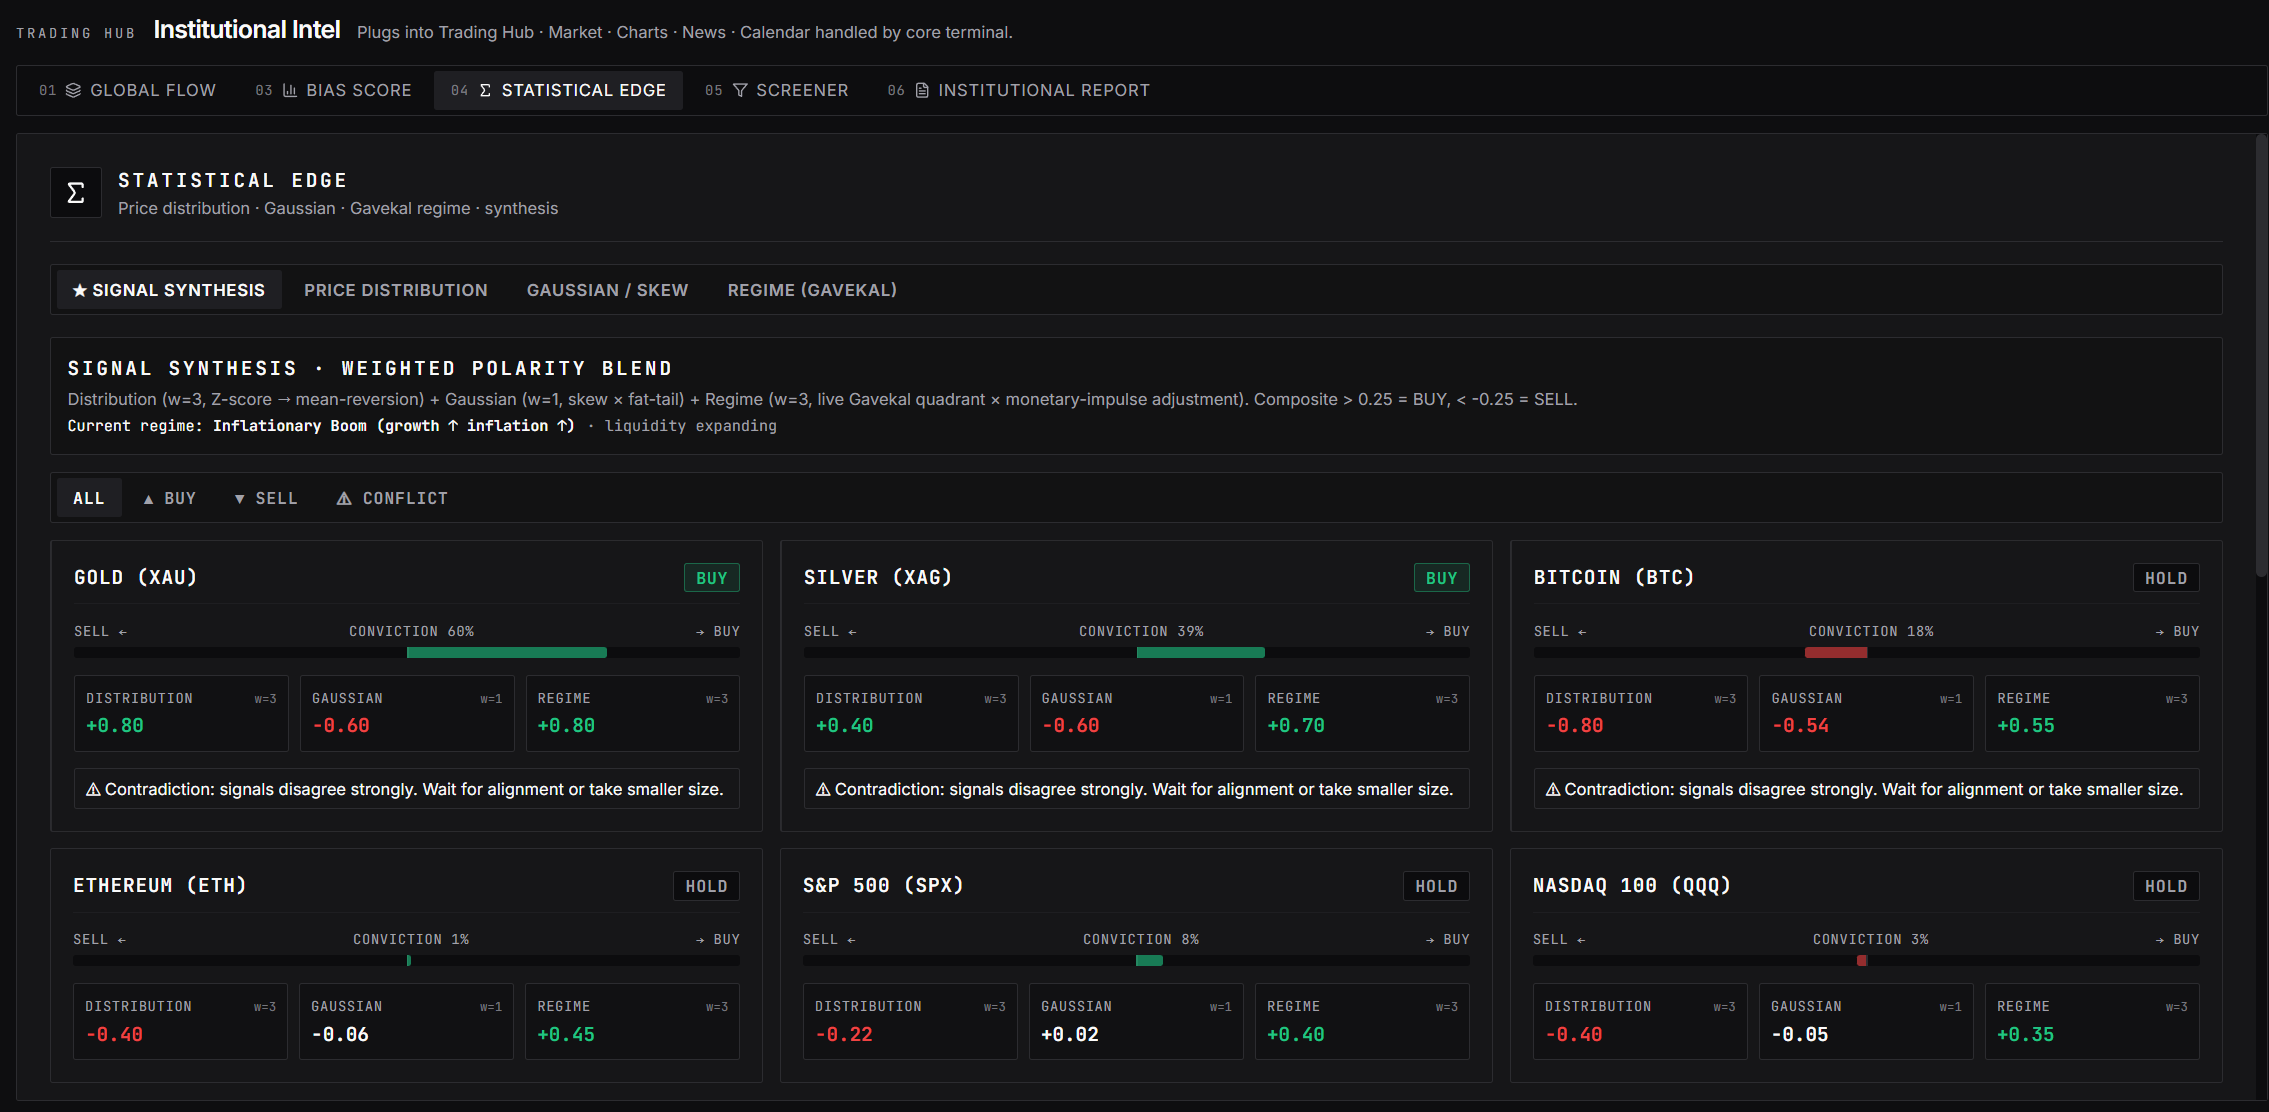
- The default lands on Signal Synthesis. Note the header: current regime tag (e.g. “Inflationary Boom (growth ↑ inflation ↑)”) + filter chips ALL / + BUY / + SELL / # CONFLICT.
- Skim every asset card:
- Asset with conviction > 60% + no contradiction warning = valid signal. Note as a trade candidate.
- Asset with ⚠ Contradiction warning (“signals disagree strongly”) = don’t trade direction until aligned. Wait, or take smaller size.
- Asset with conviction < 40% = HOLD, no directional edge, skip.
- Click the # CONFLICT filter to see disagreements: which assets have macro & statistical signals fighting each other? Don’t force entries here.
- For step-3 candidates, drill down: switch to Price Distribution, pick the asset, read price location vs the OLS regression channel:
- Price outside +2σ band = mean-revert candidate for SELL (in an uptrend channel, careful; in a flat/down channel, strong).
- Price outside −2σ band = mean-revert candidate for BUY.
- Price mid-channel = no mean-revert edge from distribution.
- Switch to the Gaussian / Skew sub-tab. Find your asset’s row, check the NORMALITY column (label NORMAL or NON-NORMAL) and TAIL READ (e.g. “Fat tails · negative skew (crash risk)” or “Near-Gaussian”):
- NON-NORMAL + tail read fat tails = distribution has fat tails, extreme moves more often than normal. Reduce position size vs default.
- NORMAL + tail read Near-Gaussian = distribution behaves normally. Default sizing OK.
- Switch to the Regime tab for macro confirmation. If Signal Synthesis says BUY but Regime says risk-off (Q3 Deflationary Bust), the trade fights the regime, lower conviction, or skip.
Reading Signal Synthesis more deeply
Each asset card in Signal Synthesis shows:
- Header: asset name + ticker (e.g. “GOLD (XAU)”).
- Dominant signal: BUY / HOLD / SELL (green / yellow / red).
- Conviction bar: % conviction (0–100). Composite of 4 polarity sub-signals.
- 3 numbers below: Distribution, Gaussian, Regime sub-scores. Sign +/− shows polarity.
- Footer note: if there’s contradiction (e.g. Distribution +0.45 but Gaussian −0.86), a warning appears.
Most actionable: conviction > 60% + 3 sub-scores aligned = strongest signal. If conviction is high but one sub-score fights it = wait for alignment.
Reading the Gaussian / Skew table
The table on the Gaussian / Skew sub-tab shows per asset (12-month window, daily returns):
| Column | What | Implication |
|---|---|---|
| MEAN (DAY) | Average daily return | Medium-term directional drift. Persistently positive = bull bias |
| ANNUAL_S | Annualized std dev | The asset’s baseline volatility |
| SKEW | Distribution asymmetry | Negative = left-skewed (crash risk > pump). Positive = right-skewed |
| EXCESS KURT | Excess kurtosis (vs normal) | High = fat tails; extreme moves more often. > 3 = sizing caution |
| JB | Jarque-Bera test stat | Normality test. High = clearly non-normal |
| NORMALITY | JB-derived label (p<0.05 critical ≈ 5.99) | NORMAL / NON-NORMAL |
| TAIL READ | Tail-risk interpretation | E.g. “Left tail · negative skew/excess crash risk” |
Most often relevant for traders: TAIL READ + EXCESS KURT. Assets with left-tail dominance + kurt > 5 = trade with extra risk management (tighter stops, smaller size), because tail events occur more often than the normal assumption suggests.
Common pitfalls
- Using it as a direct entry trigger. Stat Edge tells you the asset’s statistical location, not a price-action trigger. The trigger still comes from technical structure on the main chart.
- Ignoring contradiction warnings. When 2+ sub-signals fight each other, the headline conviction is misleading. Always check each card’s footer, if there’s a warning, treat it as HOLD regardless of the BUY/SELL arrow.
- Trading every asset at the same conviction threshold. High-baseline-volatility assets (BTC, ETH) need higher conviction to be meaningful because of more noise. Low-volatility assets (DXY, USD/CHF) can be actionable at lower conviction.
- Forgetting the 12-month window for Gaussian/Skew. Daily-return stats are computed from a rolling 12-month window. An asset that just went through a regime shift (e.g. BTC post-halving) updates slowly, Skew & Kurt won’t yet fully reflect the new regime. Note: the Price Distribution sub-tab has its own timeframe toggle (12M / 10Y).
- Equating NON-NORMAL with “bad”. Many assets are naturally NON-NORMAL (BTC, equities during tail events). Not a problem, the problem is only if you size positions as if the asset were Gaussian. Adjust sizing, don’t avoid.
- Trading on Signal Synthesis without cross-checking Price Distribution. A BUY conviction-70% signal + price outside the +2σ band = high mean-revert risk. Always cross-check price location before a trend-trade entry.
- Ignoring the Regime tab when conviction is high. A BUY signal for equity in Q4 Stagflation = fighting macro. Better to wait for a signal aligned with the regime, or take very small size.