ID EN
Intermediate 10 min read
Compare two stocks side-by-side for pair trading
Use the Compare panel to view two tickers on price, valuation, profitability, and growth, find pair trade opportunities within the same sector.
Pair trading relies on two emitens in the same sector that normally move with high correlation, then exploits temporary divergence between them. What you need: a fast way to see fundamentals, ratios, and price action side-by-side without tab-switching. The /idx/compare panel shows this in parallel columns up to 6 tickers (2–3 is typically enough for a pair trade).
Panel layout
- Access:
/idx/compare?tickers=BBCA,BBRI(URL is shareable and bookmarkable for your favorite compare setups). - Maximum 6 tickers per view.
- Per column, the panel shows metrics in the following groups:
- Price: Harga, Change (%), Sektor.
- Scale: Market cap, Revenue TTM, latest quarter.
- Valuation: PER, PBV, EV/EBITDA, PEG.
- Profitability: ROE, ROA, Net margin.
- Leverage: DER.
- Liquidity: Current ratio.
- Dividend: Div yield.
- Growth: Revenue YoY, Earnings YoY.
- Input field to add a ticker, remove button (×) per column.
- Each column fetches data independently, if one ticker fails to load, the others still work.
Prerequisites for a valid pair
Pairs can’t be picked at random. Valid candidates must satisfy:
- Same sector, banking with banking, consumer with consumer. Different sectors have correlations too low for reliable mean reversion.
- Same market cap tier, don’t pair small-cap with big-cap. Liquidity differences are too wide; slippage will eat PnL.
- High historical correlation, visually check the 1Y chart, the two lines should crisscross often. If one is far more volatile, mean reversion isn’t reliable.
- No major pending corporate action in either (rights issue, acquisition, spin-off), that will break correlation structurally.
Workflow: identify a pair trade
- Open
/idx/compare?tickers=A,B(substitute A & B with same-sector candidates, e.g.BBCA,BBRIorINDF,ICBP). - Compare PER & PBV:
- If the two normally trade at similar PER ratios (spread < 15%) but the spread is now > 30% = valuation gap, one is relatively expensive/cheap.
- Check whether the gap has fundamental cause (ROE divergence, growth divergence) or is just temporary (sentiment shock on one).
- Compare daily/weekly performance via the Change (%) column: if A is −5% over a week while B is flat, and historically they always move in parallel, A may mean-revert toward B.
- Set up the pair trade:
- Long pair: long the underperformer, short the outperformer (if shorting is available).
- Long-only adjustment: if shorting isn’t available on IDX (typical for retail), the pair trade becomes a rotation, sell holdings of the outperformer, buy the underperformer, expect mean reversion.
- Define exit: spread returns to historical baseline (PER spread < 15% or performance gap < 2%). Stop if divergence keeps widening (might be a real fundamental reason, not temporary).
Concrete scenario
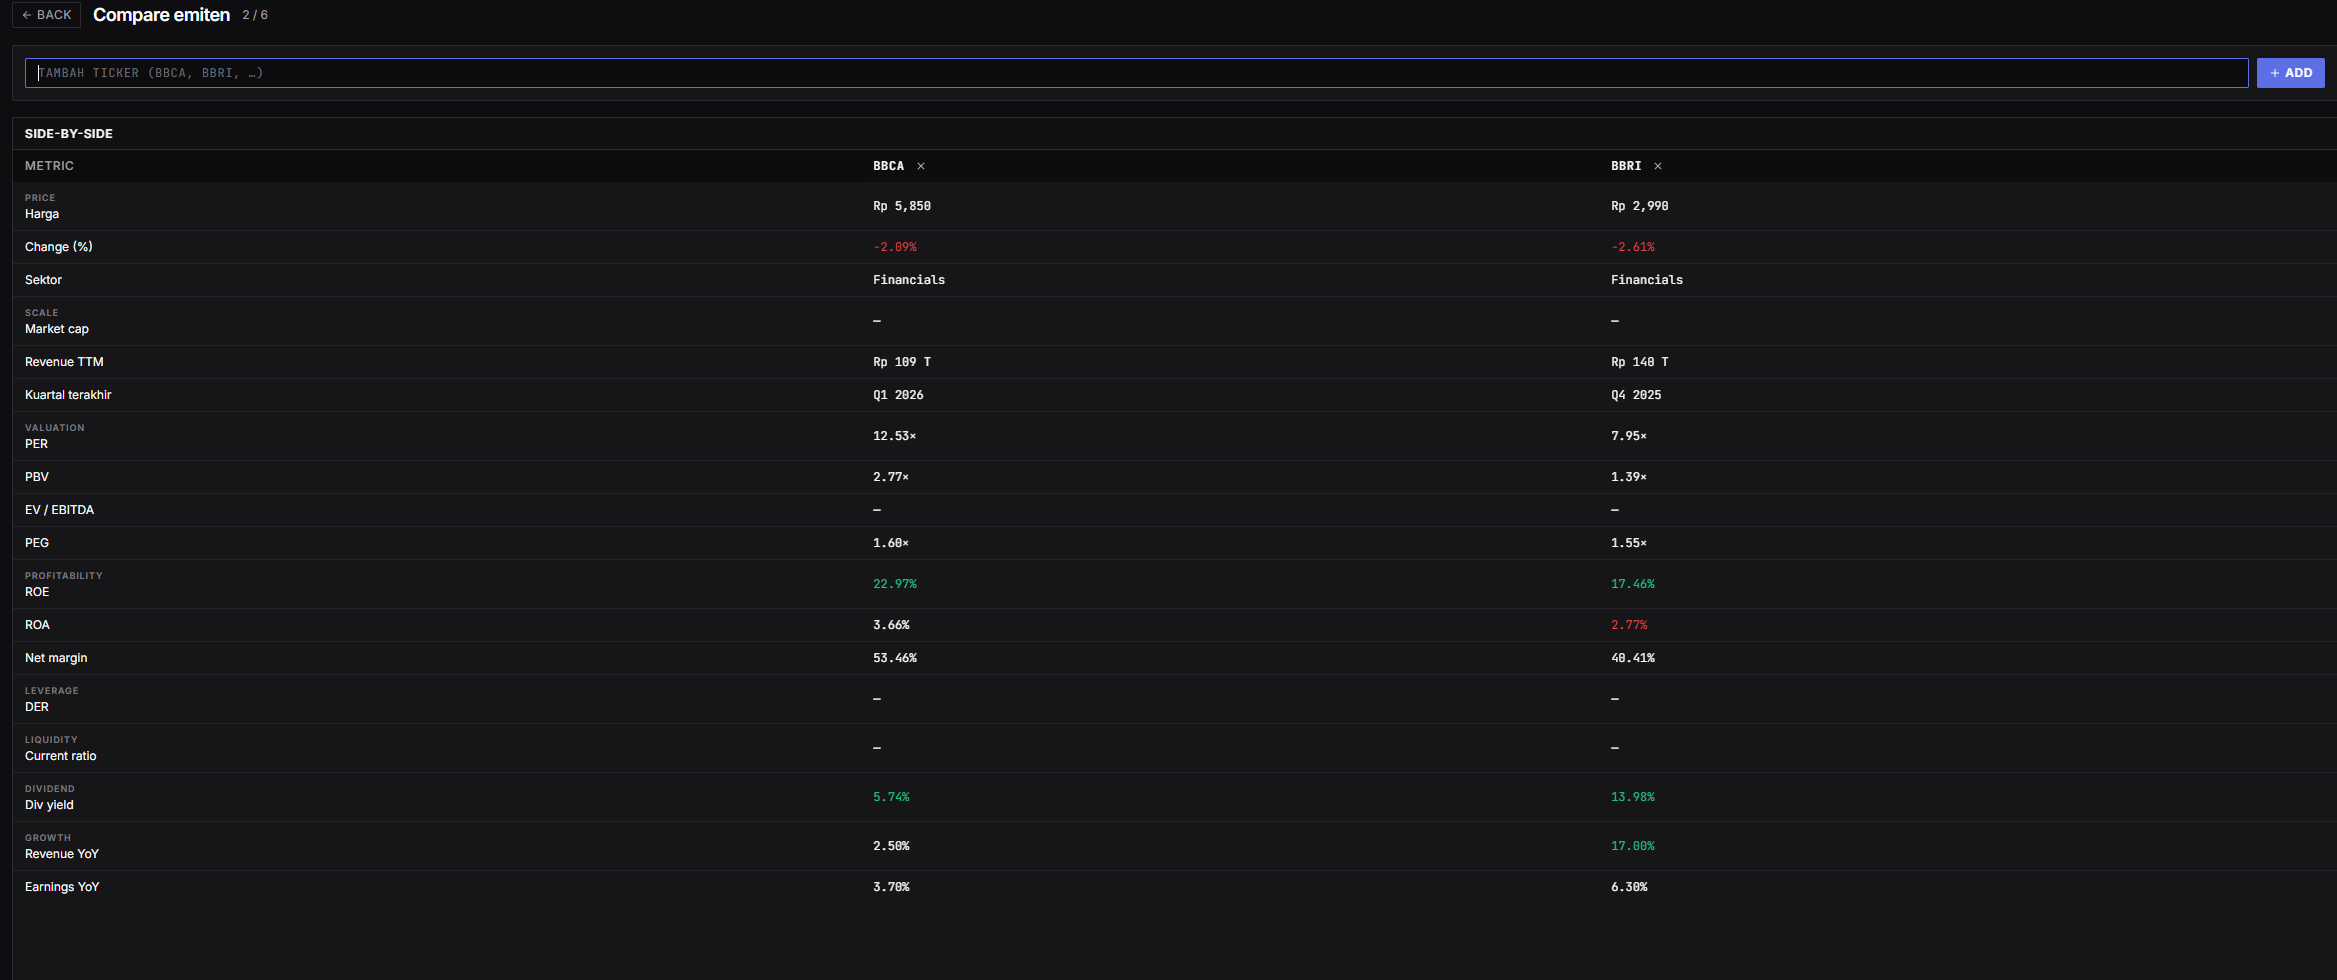
Compare BBCA vs BBRI (banking blue chips):
- BBCA PER 12.53, BBRI PER 7.95. Spread ~58%, above the historical baseline (~30%).
- BBCA ROE 22.97%, BBRI ROE 17.46%. The 5pt difference partly explains it, but not enough for a 58% PER gap.
- 30-day performance (hypothetical): BBCA −2.09%, BBRI −2.61%. Spread is small at the short window, but the structural valuation gap remains.
- Setup: long BBRI (under-loved), medium-term bias is larger toward BBRI than BBCA. Target: PER spread tightens back to baseline ~30%.
(Scenario for illustration, not a real trade recommendation; always validate with your own research.)
Common pitfalls
- Pair trading across sectors. Correlation is structurally low, no mean to revert to. Stay within the same sector.
- Assuming historical correlation is always persistent. Correlations break (new regulation, business model change, acquisition). Re-validate visually each quarter.
- Skipping the fundamentals check. A valuation spread sometimes reflects reality: the cheaper-trading emiten really is fundamentally weaker. Cross-check ROE, growth, and earnings quality before assuming “cheap = bargain”.
- Ignoring corporate action on one ticker. A dilutive rights issue lowers PER/PBV on that emiten, the attractive-looking valuation gap is a temporary accounting artifact.
- Using too short a timeframe. Pair trades on IDX usually need 2–6 weeks to mean-revert. A setup with a 1–3 day target = scalping, requires a different tool.
- No stop set. Pair trades fail when divergence keeps widening. Place a stop based on additional widening (e.g. +10% spread beyond setup), not on absolute price levels.